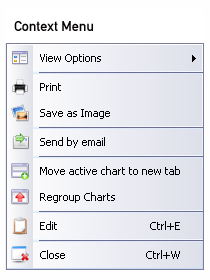
Most of the common tasks a user may need to do with a single chart file are grouped into a context menu that can be activated by clicking the right mouse button anywhere over the Chart Viewer Panel.

Some context menu items depend of the type of chart currently focused.
Activation Highlights and Information Popups
MMI2 can track the movements of the cursor across the chart and highlight distinct activation areas within the chart.
Whenever a highlight appears on the chart the user can click it and cause an Information Popup to appear containing a summary of data related to that activation area.

Please note that this functionality is only available to licensed users.