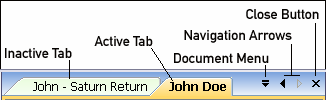
The Tab bar contains the following objects:
* A collection of Tabs representing all of the Charts that are currently open. Of these Charts only one is 'Active' or focused. The Active Tab is highlighted in orange color and it's name is displayed using bold text. All other Tabs (inactive charts) have a green background color.
The Information Pane as well as all the other features are always synched to the currently Active Chart.
* The Document Menu that contains a linear list of all open documents.
* The Navigation Arrows allow the user to scroll the Tab list right or left. These buttons only become enabled if the list of open tabs is too large to fit on the screen at the same time.
* The Close Button which allows users to close charts.
Using the Document Tab Bar
To switch between charts simply click the desired tab and it will become the Active chart. The Information Pane as well as all other Chart related features of MMI are synched to the Active chart and are updated whenever a new Chart (or Tab) become active.
If there are enough open charts so that the entire list cannot fit on the screen, the navigation arrows become enabled and can be used to scroll the list to left or right.
Alternatively, the Document Menu can be used to obtain a linear list of all open charts and a click on any of these will make that chart become active and bring into view.
To close a chart click the Close button on the right hand side of the Document Tab Bar.
The Tab Context Menu
Clicking a Tab with the right mouse button will Popup the Tab's context menu:
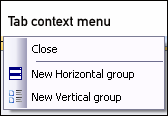
The context menu allows you to Close the corresponding Chart and (if you have more than one chart open) to split the Document Window.